モニタリング
カスタムコントローラーの運用にはモニタリングが重要です。 システムを安定運用させるためには、カスタムコントローラーが管理するリソースやカスタムコントローラー自身に何か問題が生じた場合、 それを検出して適切な対応をおこなう必要があります。
ここでは、controller-runtimeが提供するメトリクス公開の仕組みについて紹介します。
基本メトリクス
Kubebuilderが生成したコードでは、自動的に基本的なメトリクスが公開されるようになっています。 CPUやメモリの使用量や、Reconcileにかかった時間やKubernetesクライアントのレイテンシーなど、controller-runtime関連のメトリクスが公開されています。
まずは、どのようなメトリクスが公開されているのか見てみましょう。
なお、Kubebuilderが自動生成した状態では、RBACにより権限を与えられたアカウントのみがメトリクスを取得できるようになっています。
そこで、一時的にconfig/manager/manager.yamlのオプションに--metrics-bind-address=:8080と--metrics-secure=falseを指定して、誰でもメトリクスを取得できるようにします。
- command:
    - /manager
  args:
    - --leader-elect
    - --health-probe-bind-address=:8081
+    - --metrics-bind-address=:8080
+    - --metrics-secure=false
  image: controller:latest
  name: manager
上記の変更を適用し、メトリクス用のポートをPort Forwardします。
kubectl -n markdown-view-system port-forward deploy/markdown-view-controller-manager 8080:8080
curlを実行すると、下記のようなメトリクスが出力されます。
$ curl localhost:8080/metrics
# HELP controller_runtime_active_workers Number of currently used workers per controller
# TYPE controller_runtime_active_workers gauge
controller_runtime_active_workers{controller="markdownview"} 0
# HELP controller_runtime_max_concurrent_reconciles Maximum number of concurrent reconciles per controller
# TYPE controller_runtime_max_concurrent_reconciles gauge
controller_runtime_max_concurrent_reconciles{controller="markdownview"} 1
# HELP controller_runtime_reconcile_errors_total Total number of reconciliation errors per controller
# TYPE controller_runtime_reconcile_errors_total counter
controller_runtime_reconcile_errors_total{controller="markdownview"} 0
# HELP controller_runtime_reconcile_total Total number of reconciliations per controller
# TYPE controller_runtime_reconcile_total counter
controller_runtime_reconcile_total{controller="markdownview",result="error"} 0
controller_runtime_reconcile_total{controller="markdownview",result="requeue"} 0
controller_runtime_reconcile_total{controller="markdownview",result="requeue_after"} 0
controller_runtime_reconcile_total{controller="markdownview",result="success"} 0
# HELP controller_runtime_webhook_requests_in_flight Current number of admission requests being served.
# TYPE controller_runtime_webhook_requests_in_flight gauge
controller_runtime_webhook_requests_in_flight{webhook="/mutate-view-zoetrope-github-io-v1-markdownview"} 0
controller_runtime_webhook_requests_in_flight{webhook="/validate-view-zoetrope-github-io-v1-markdownview"} 0
# HELP controller_runtime_webhook_requests_total Total number of admission requests by HTTP status code.
# TYPE controller_runtime_webhook_requests_total counter
controller_runtime_webhook_requests_total{code="200",webhook="/mutate-view-zoetrope-github-io-v1-markdownview"} 0
controller_runtime_webhook_requests_total{code="200",webhook="/validate-view-zoetrope-github-io-v1-markdownview"} 0
controller_runtime_webhook_requests_total{code="500",webhook="/mutate-view-zoetrope-github-io-v1-markdownview"} 0
controller_runtime_webhook_requests_total{code="500",webhook="/validate-view-zoetrope-github-io-v1-markdownview"} 0

・・・ 以下省略
カスタムメトリクス
controller-runtimeが提供するメトリクスだけでなく、カスタムコントローラー固有のメトリクスの公開もできます。 詳しくはPrometheusのドキュメントを参照してください。
ここではMarkdownViewリソースのステータスをメトリクスとして公開してみましょう。
package controller

import (
    "github.com/prometheus/client_golang/prometheus"
    "sigs.k8s.io/controller-runtime/pkg/metrics"
)

const (
    metricsNamespace = "markdownview"
)

var (
    AvailableVec = prometheus.NewGaugeVec(prometheus.GaugeOpts{
        Namespace: metricsNamespace,
        Name:      "available",
        Help:      "The cluster status about available condition",
    }, []string{"name", "namespace"})
)

func init() {
    metrics.Registry.MustRegister(AvailableVec)
}
メトリクスを更新するための関数を用意します。
func (r *MarkdownViewReconciler) setMetrics(mdView viewv1.MarkdownView) {
    if meta.IsStatusConditionTrue(mdView.Status.Conditions, viewv1.TypeMarkdownViewAvailable) {
        AvailableVec.WithLabelValues(mdView.Name, mdView.Namespace).Set(1)
    } else {
        AvailableVec.WithLabelValues(mdView.Name, mdView.Namespace).Set(0)
    }
}
Statusを更新する際にこの関数を呼び出します。
r.setMetrics(mdView)
また、メトリクスを削除するための関数も用意します。
func (r *MarkdownViewReconciler) removeMetrics(mdView viewv1.MarkdownView) {
    AvailableVec.DeleteLabelValues(mdView.Name, mdView.Namespace)
}
以下のように、リソースが削除された際にメトリクスを削除するようにしましょう。
var mdView viewv1.MarkdownView
err := r.Get(ctx, req.NamespacedName, &mdView)
if errors.IsNotFound(err) {
    r.removeMetrics(mdView)
    return ctrl.Result{}, nil
}
先ほどと同様にメトリクスを確認してみましょう。 下記の項目が出力されていれば成功です。
$ curl localhost:8080/metrics

# HELP markdownview_available The cluster status about available condition
# TYPE markdownview_available gauge
markdownview_available{name="markdownview-sample",namespace="markdownview-sample"} 1
Grafanaでの可視化
それでは実際にPrometheusとGrafanaを使って、コントローラーのメトリクスを可視化してみましょう。
まずはマニフェストの準備をします。
config/default/kustomization.yamlの- ../prometheusのコメントを解除してください。
resources:
- ../crd
- ../rbac
- ../manager
# [WEBHOOK] To enable webhook, uncomment all the sections with [WEBHOOK] prefix including the one in
# crd/kustomization.yaml
- ../webhook
# [CERTMANAGER] To enable cert-manager, uncomment all sections with 'CERTMANAGER'. 'WEBHOOK' components are required.
- ../certmanager
# [PROMETHEUS] To enable prometheus monitor, uncomment all sections with 'PROMETHEUS'.
- ../prometheus
# [METRICS] Expose the controller manager metrics service.
- metrics_service.yaml
make manifestsを実行してマニフェストを生成し、Kubernetesクラスターに適用しておきます。
Prometheus Operatorをセットアップするために、下記の手順に従ってHelmをインストールします。
つぎにHelmのリポジトリの登録をおこないます。
helm repo add prometheus-community https://prometheus-community.github.io/helm-charts
helm repo update
Prometheus Operatorをセットアップします。完了まで少し時間がかかるので待ちましょう。
kubectl create ns prometheus
helm install prometheus prometheus-community/kube-prometheus-stack --namespace=prometheus --set prometheus.prometheusSpec.serviceMonitorSelectorNilUsesHelmValues=false
kubectl wait pod --all -n prometheus --for condition=Ready --timeout 180s
起動したPrometheusにメトリクスを読み取る権限を付与する必要があるので、下記のマニフェストを適用します。
apiVersion: rbac.authorization.k8s.io/v1
kind: ClusterRoleBinding
metadata:
  name: metrics
roleRef:
  apiGroup: rbac.authorization.k8s.io
  kind: ClusterRole
  name: markdown-view-metrics-reader
subjects:
  - kind: ServiceAccount
    name: prometheus-kube-prometheus-operator
    namespace: prometheus
kubectl apply -f ./config/rbac/prometheus_role_binding.yaml
ローカル環境からGrafanaの画面を確認するためにポートフォワードの設定をおこないます。
kubectl port-forward service/prometheus-grafana 3000:80 --address 0.0.0.0 --namespace prometheus
ブラウザからhttp://localhost:3000でGrafanaの画面が開くので、ユーザー名とパスワードを入力してログインします。
- Username:
admin - Password:
prom-operator
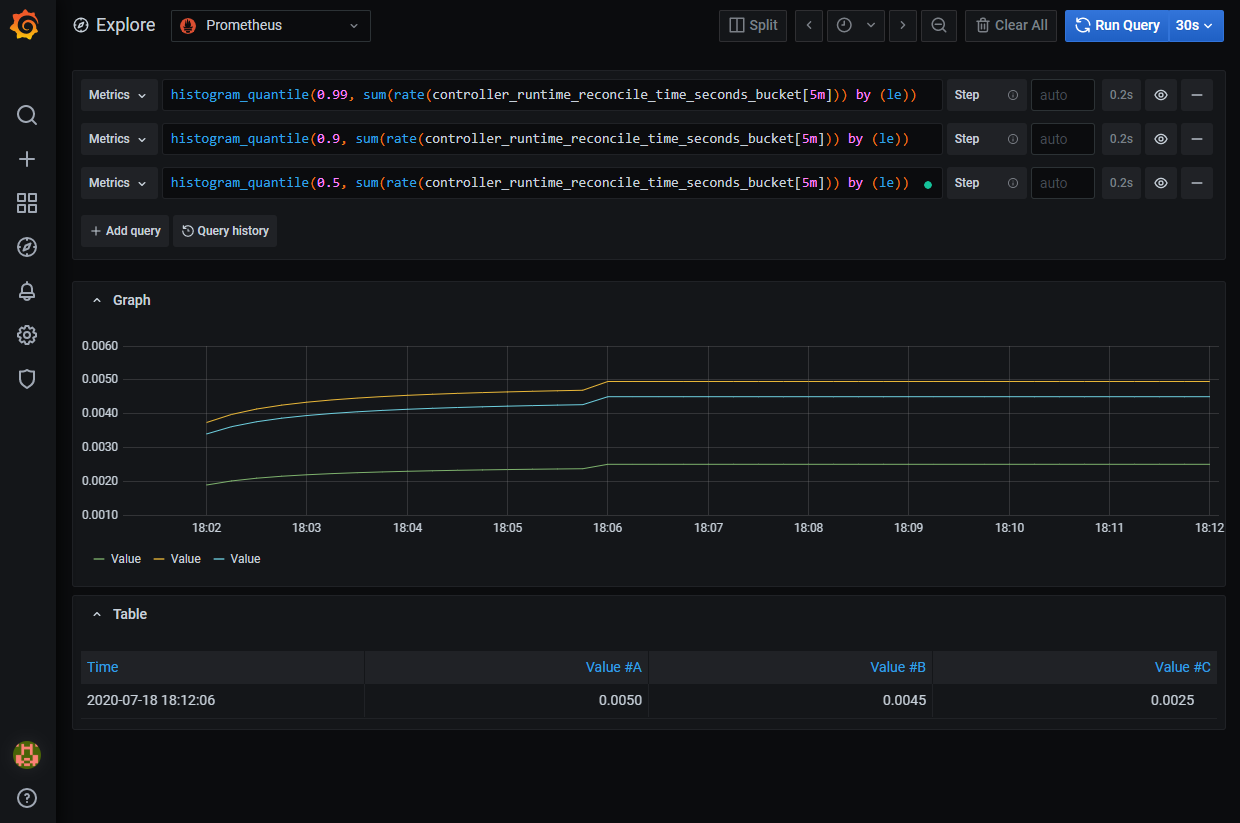
Explore画面を開いて以下のようなPromQLを入力してみましょう。これによりReconcileにかかっている処理時間をモニタリングできます。
histogram_quantile(0.99, sum(rate(controller_runtime_reconcile_time_seconds_bucket[5m])) by (le))